In a moment of frustration about lower-than-deserved profits, you may have uttered, “Let’s just fire our unprofitable customers!” While that may be overkill, the thought process has merit. All customers are not the same, and preferential treatment to the highest-value customers is warranted.
In the 1980s, Illinois Tool Works (ITW) introduced their 80/20 methodology, which explicitly calls for treating the 20% of customers who generate 80% of profits differently. It has been a critical component of their growth from a small machine shop in Chicago to a $14.1 billion diversified manufacturing company with a 24.1% operating margin.
The first step in this journey is to understand how much each customer contributes to profitability. If life were easy, you’d simply run a gross margin report and sort them in descending order. You’d draw a line on the sheet, and anyone below that line gets a significant price increase.
However, that approach would be a mistake. Gross margin is deeply flawed for this kind of analysis. The underlying issue is that standard cost systems don’t accurately reflect each customer’s real costs. This disconnect has two drivers:
- The method of applying overhead to products is somewhat arbitrary (labor hours or machine hours).
- Many customer-driven costs hit the P&L below the gross margin line, and they become part of the general overhead structure and not assigned to a product.
Let’s explore this further by defining four customer types, as illustrated in the chart below.
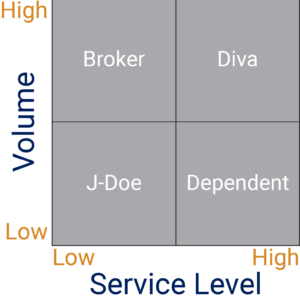
The X-axis is the Service Level, and it indicates the amount of “add on” service a customer demands. Customers who rank high on Service Level may require services such as inventory stocking positions, compliance with bureaucratic quality systems, small lot sizes, participation on product development projects, and guaranteed annual price reductions. These aren’t necessarily bad, but they aren’t free either.
The other axis is Volume, indicating the amount of business that the customer does with you.
The combination of Service Level and Volume defines the four customer types: Diva, Dependent, J-Doe, and Broker.
In the rest of this article, we’ll explore each customer type and how gross margin might inform, or misinform, our view of the customer’s impact on profitability.
Diva:
Definition: A high-volume customer that demands high service levels
These are the customers that elicit a love-hate relationship. They demand more every year. The customer knows that they have power, and they are fully prepared to use it.
Gross margins tend to be overstated for Divas, making you think they create more profit than they do. The reason is that many of the services that Divas demand fall outside of the standard product cost. All of those extra services become part of the overhead, and then they get distributed to ALL customers. This accounting method makes Diva’s profitability look strong at the expense of less-demanding customers.
Senior leaders must manage Divas strategically. They can be challenging, but they can also make a company better by forcing innovation and growth.
Dependent:
Definition: A low-volume customer that needs high levels of service
Dependents are a group of customers who want more add-on services than their recurring revenue might warrant. They may be a small company lacking internal resources or a product development team within a larger organization. In both cases, they are dependent on your technical expertise.
Like Divas, gross margin reports overstate Dependent profitability because most of the costs they drive happen outside of the product’s production.
Leadership teams should evaluate Dependents carefully because they can drive considerable costs with no commensurate revenue. It may be advantageous to implement a practice of charging for engineering, design, and prototyping work for this customer type. At one company I ran, we established a policy of “No Inventors.”
J-Doe:
Definition: A customer that doesn’t purchase much or need much support
J-Doe customers are somewhat nameless and unseen. They are a small customer, and they fly under the radar. Individually they don’t have much of an impact on revenues, costs, or profits. However, when combined, their impact can be significant.
Given the low service needs of the J-Does, gross margins tend to be a reasonable approximation of customer profitability. This group should be reviewed occasionally, perhaps yearly, to ensure that margins continue to be healthy and internal costs haven’t crept upwards.
Broker:
Definition: A customer that buys in high volumes but requires few add-on services.
The “Broker” is the final type of customer. They buy in volumes, and the price is the primary driver. The Broker has reasonable quality and delivery expectations.
A Broker’s margins can look skinny. However, this can be misleading because the amount of overhead needed to support the Broker is often far less than that of customers requiring high service levels, like Divas.
When analyzing the impact of a Broker on profitability, it is helpful to look at the dollars that the customer contributes to the overall company profitability rather than a percentage. I usually use contribution margin dollars, which is the revenue minus the direct labor costs and materials. It is common to see that Broker customers contribute large dollars towards profitability, despite the low margin percentage.
One of the most significant opportunities I see is for companies to win more Broker business. The perception of “not being able to compete” is often false self-talk driven by the standard costing system. If you have excess capacity, a few Broker customers can make a world of difference to the company’s profitability.
Wrap-up
Managing various customers strategically can pay enormous dividends. All customers are not created equal, and they should not be treated as one homogenous group. One of the first steps to create a profit-driven customer strategy is to understand customer profitability at a deeper level. This requires looking beyond the typical gross margin report and understanding which customers are truly driving the company’s costs. The analysis takes a little work, but it’s a straightforward exercise, and it’s likely easier than you may think. I’ll cover this further in next month’s issue.
If you’d like to get a clearer picture of customer profitability, please reach out to me. I’d love to help you get the insights you need to drive the profits you deserve.
About the author: Rob is a consultant that focuses on helping leaders of small and mid-size manufacturers to achieve their goals. He specializes in custom-tailored operating systems and strategic consulting. He can be reached at 651-398-9280, LinkedIn or rob@robtracy.net